

State and local government contracting started strong in 2026, with steady activity across the Pacific Northwest and California.
In the first quarter, RFPGo.ai processed 829 RFPs across California, Washington, Oregon, and Idaho. The strongest demand centered on planning, technology modernization, infrastructure, and human services — the kinds of professional services that help public agencies make decisions, maintain core systems, and deliver programs more effectively.
This analysis uses the same eight plain-English categories from RFPGo.ai’s 2025 state and local government contracting snapshot. These categories are not an industry standard; they are a practical way to make a messy market easier to understand. Readers can view the full category definitions in the earlier post, A 2025 Snapshot of State and Local Government RFPs—and the Eight Categories That Make Them Legible.
This activity also fits the broader economic picture. The Bureau of Economic Analysis (BEA) reported that real GDP increased at a 2.0% annual rate in Q1 2026, up from 0.5% in Q4 2025. The increase was supported by investment, exports, consumer spending, and government spending — a backdrop that helps explain why public agencies continued to move forward with planning, systems, infrastructure, and service-delivery procurements.
Q1 2026 at a glance
The market picked up throughout the quarter
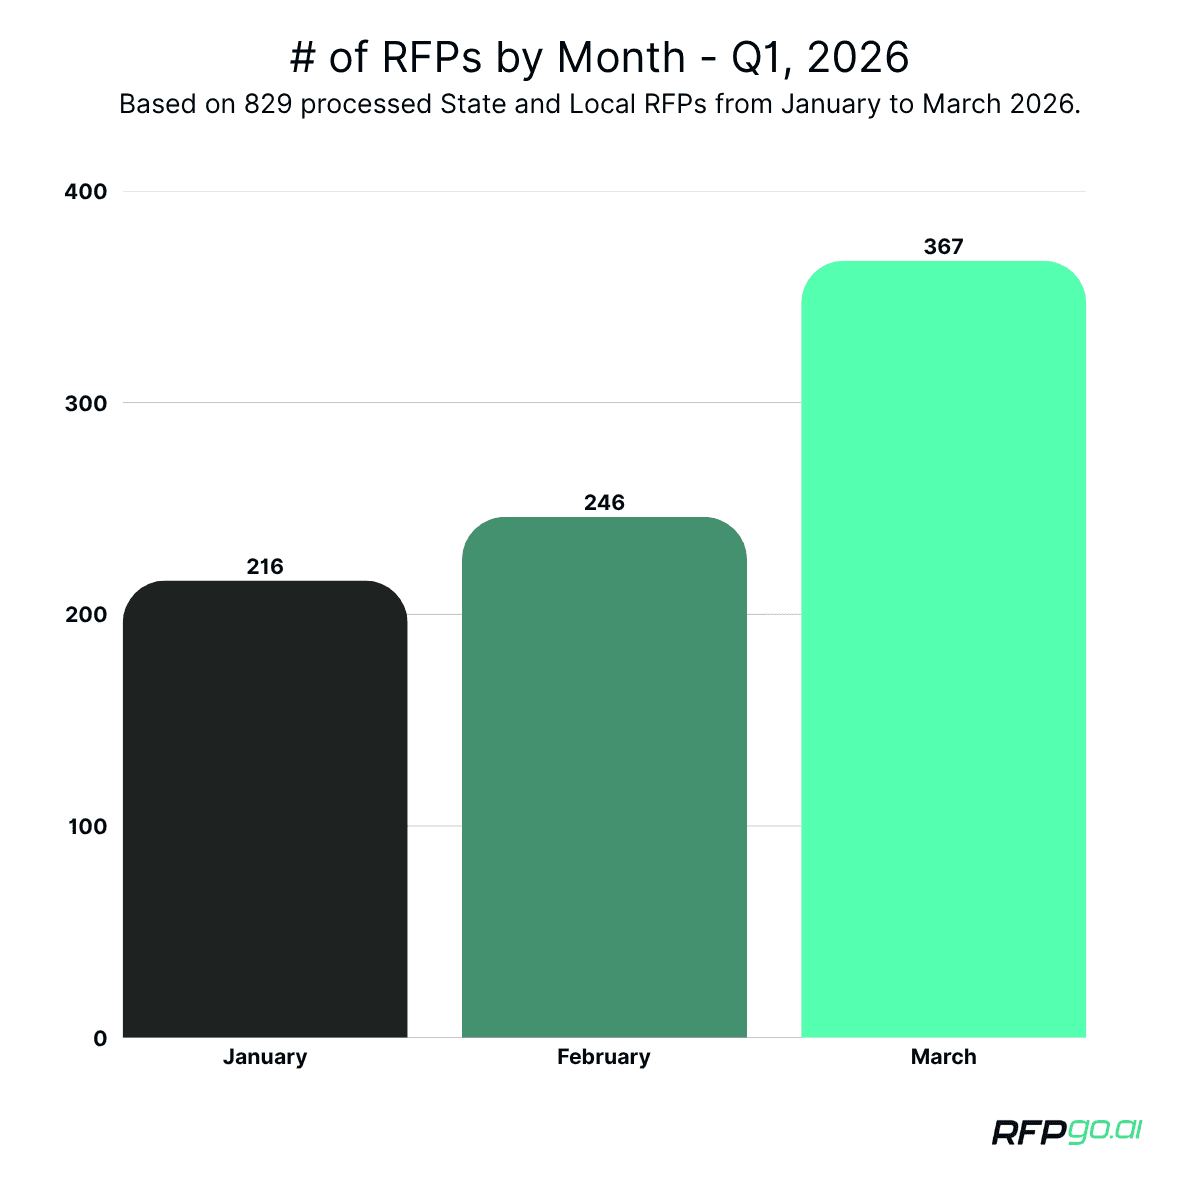
That increase matters. It suggests that agencies were not simply maintaining a slow procurement rhythm. Activity accelerated as the quarter progressed, likely reflecting agencies moving deeper into calendar-year planning and closer to fiscal-year budgeting, implementation, and contract award timelines.
For vendors, the lesson is straightforward: RFP review cannot be occasional. Strong opportunities can cluster quickly, and many have short response windows. A weekly review rhythm matters.
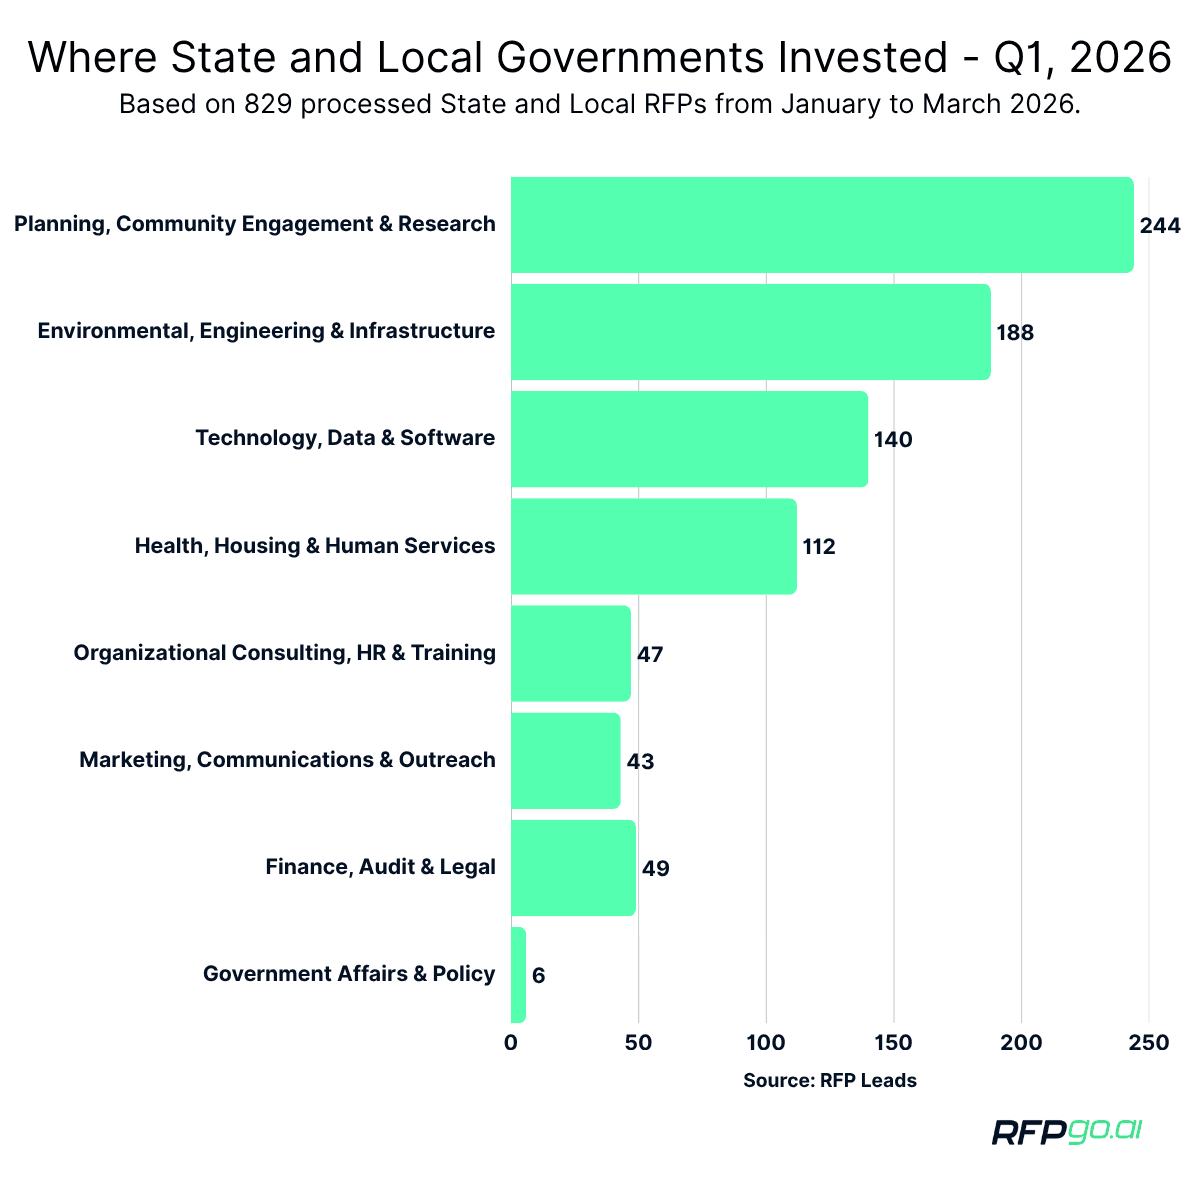
Planning, community engagement, and research led the quarter
The largest category in Q1 was Planning, Community Engagement & Research, with 244 RFPs, or 29.4% of the total.
That is the biggest takeaway from the quarter.
A large share of state and local contracting is not immediately about implementation. It starts earlier, with feasibility studies, strategic plans, community engagement, needs assessments, program evaluations, rate studies, policy analysis, and technical reports.
In plain terms, governments are asking:
What should we do next?
What does the data say?
How should we prioritize limited resources?
How do we engage the community before making decisions?
How do we evaluate whether current programs are working?
This lines up with the broader Q1 economic picture. BEA noted that investment and government spending contributed to real GDP growth in the first quarter. At the state and local level, that same theme shows up in the RFP market through demand for consultants who can help agencies plan investments, evaluate programs, and make better use of limited resources.
For consultants, evaluators, researchers, facilitators, and planning firms, this is a strong signal. If your work helps public agencies make better decisions, structure programs, or build a roadmap before implementation, state and local governments continue to generate steady demand.
Technology, data, and software continued to show up across agencies
Technology, Data & Software accounted for 140 RFPs, or 16.9% of Q1 activity.
This category included software systems, data platforms, portals, case management tools, GIS, websites, system integrations, IT support, and other modernization efforts.
The pattern is clear: state and local agencies are still trying to replace outdated systems, improve internal workflows, digitize public-facing services, and make better use of data.
BEA’s Q1 release also pointed to growth in investment, including equipment and intellectual property products, with software cited as part of that increase. That does not map one-for-one to public-sector RFPs, but it reinforces the broader modernization environment in which many agencies and vendors operate.
For technology vendors, systems integrators, data consultants, and software firms, the opportunity is not just “IT.” It is an operational improvement. Agencies are looking for tools that reduce manual work, improve visibility, support reporting, and help staff deliver services with fewer bottlenecks.
Environmental, engineering, and infrastructure remained a backbone of demand
Environmental, Engineering & Infrastructure was the second-largest category by volume, with 188 RFPs, or 22.7% of Q1 activity.
These opportunities included engineering, transportation, facilities planning, public works, stormwater, water resources, environmental review, capital planning, and related consulting services.
This category is not surprising, but it matters. Even when broader economic conditions shift, local governments still have to maintain roads, facilities, water systems, stormwater systems, parks, public works assets, and environmental compliance programs.
Many of these RFPs were not massive construction solicitations. They were the professional services that come before, beside, or after capital projects: design, analysis, planning, environmental review, compliance, inspection, public engagement, and program management.
That creates opportunities beyond large engineering firms. Smaller and specialized firms can find openings in environmental consulting, capital planning, grant support, feasibility analysis, water resources, and regulatory compliance.
Health, housing, and human services remained steady
Health, Housing & Human Services accounted for 112 RFPs, or 13.5% of the Q1 total.
These opportunities included homelessness services, behavioral health, public health, family services, youth programs, supportive housing, clinical support, and delivery of human services programs.
This category is often more complex than it appears. Many opportunities require service delivery, evaluation, compliance reporting, trauma-informed approaches, culturally responsive programming, and coordination across multiple agencies.
This also connects to the broader economy. BEA reported that consumer spending growth in Q1 was supported by services, led by health care. While that is a national economic measure, it is consistent with what the RFP market showed in Q1: health, housing, and human services remained a steady area of public-sector demand.
For nonprofits, community-based organizations, public health consultants, behavioral health providers, evaluators, and housing strategy firms, this remains one of the most important categories to watch.
Organizational consulting, HR, and training remained a targeted but important category
Organizational Consulting, HR & Training accounted for 47 RFPs, or 5.7% of Q1 activity.
These opportunities included workforce planning, classification and compensation studies, leadership development, training, recruiting support, investigations, facilitation, and organizational effectiveness work.
While this category was smaller than planning, infrastructure, technology, and human services, it remains important because it reflects a persistent internal challenge across public agencies: capacity.
Governments are trying to recruit, retain, train, and manage teams while continuing to deliver essential services. For firms with HR, workforce, training, and organizational development expertise, these RFPs can be strong-fit opportunities.
Marketing, communications, and outreach remained a steady niche
Marketing, Communications & Outreach accounted for 43 RFPs, or 5.2% of the Q1 total.
These opportunities included public outreach, creative services, marketing strategy, public relations, campaigns, and communications support.
This category is especially relevant for firms that understand public-sector audiences. Government communications work is not just about promotion. It often requires trust-building, accessibility, multilingual outreach, community engagement, and clear messaging around public programs.
Finance, audit, and legal opportunities continued to appear
Finance, Audit & Legal accounted for 49 RFPs, or 5.9% of Q1 activity.
This category included audits, fee studies, revenue analysis, legal services, compliance support, claims-related services, and financial advisory work.
Although smaller by total count, this category can be high-value for specialized firms. Public agencies regularly need outside support to maintain compliance, evaluate revenue structures, conduct audits, manage risk, and navigate legal or financial requirements.
Government affairs and policy remained the smallest category
Government Affairs & Policy accounted for 6 RFPs, or 0.7% of Q1 activity.
This was the smallest category by far. That is not surprising. Legislative advocacy, lobbying, and government relations work tend to be narrower and more specialized than planning, infrastructure, technology, or human services.
Still, these opportunities matter for firms with the right relationships and policy expertise. They are less frequent, but often highly targeted.
Cities and counties drove most of the opportunity volume
Cities represented 414 RFPs, or about half of the Q1 total. Counties represented another 266 RFPs, or roughly one-third.
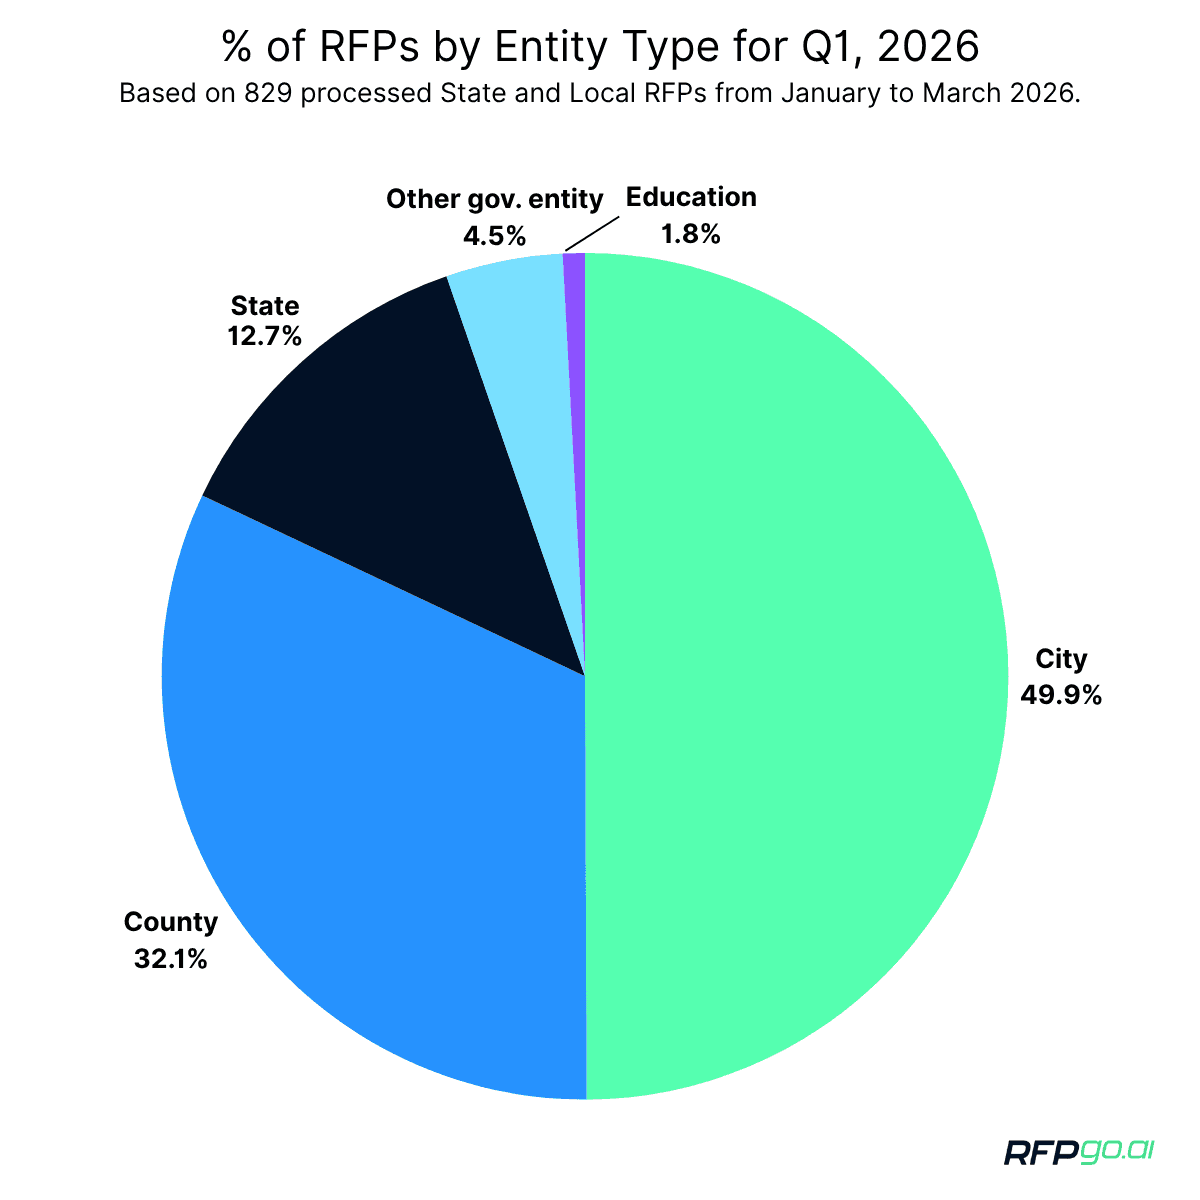
Together, cities and counties accounted for 680 of the 829 RFPs, or 82.0% of all processed opportunities.
This is one of the most important lessons for firms pursuing government work: state agencies matter, but local government is where much of the recurring professional services opportunity lives.
Cities and counties need support with planning, infrastructure, public safety, housing, technology, finance, HR, communications, and compliance. They also often have fewer internal resources than larger state agencies, which can create steady demand for outside expertise.
Most RFPs still did not include a stated budget
Only 245 of the 829 RFPs included a stated budget, or 29.6%.
That means more than 70% of the opportunities did not provide a clear budget in the parsed record.
For vendors, this is a practical reminder: budget transparency remains uneven. Firms need a disciplined bid/no-bid process that looks beyond the stated budget. Scope, agency size, contract type, historical spending, incumbent signals, and proposal burden all matter.
A missing budget should not automatically disqualify an opportunity, but it should prompt a closer look.
What this means for firms pursuing government work
Q1 2026 reinforces a simple point: state and local government contracting is not one market. It is a collection of recurring patterns.
The strongest Q1 patterns were:
Governments are buying analytical capabilities and decision support.
Plans, studies, evaluations, feasibility work, and community engagement were the largest category.
Technology modernization is not slowing down.
Agencies are still looking for software, data systems, portals, integrations, and IT support to improve how they operate.
Infrastructure remains a steady backbone.
Engineering, environmental, facilities, transportation, water, and public works opportunities continued to represent a large share of the market.
Human services demand remains persistent.
Housing, public health, behavioral health, youth, family, and community services continue to generate meaningful opportunities.
Most opportunities are local.
Cities and counties made up more than 80% of Q1 volume.
The market accelerated in March.
RFP volume increased each month, with March accounting for the largest share of the quarter.
The takeaway
If you are trying to build a public-sector pipeline in 2026, the opportunity is not just in chasing the biggest RFPs.
The firms that do well in this market are not just reacting to individual solicitations. They understand recurring demand categories, know where their services fit, and build a repeatable process for reviewing, qualifying, and pursuing opportunities.
Q1 2026 showed a market focused on planning, modernization, infrastructure, and service delivery.
For small and mid-sized firms, that is encouraging. These are not abstract categories. They are real, repeatable needs — and they show up every week across state and local government.


