State and local government contracting continued to build momentum in Q2 2026, outpacing the first quarter despite a cooling national economy.
From April through June, RFPGo.ai processed 953 RFPs from 272 unique government entities across California, Washington, Oregon, and Idaho — a 15% increase over the 829 RFPs processed in Q1. Part of that increase reflects continuous process improvements, including the addition of tribal government procurement sources across the states we cover. But the growth is also directionally consistent with broader government spending data.
According to the Federal Reserve Economic Data (FRED) series published by the Federal Reserve Bank of St. Louis, state and local government consumption expenditures and gross investment rose from $3,429 billion in Q1 2026 to $3,558 billion in Q2 2026 (Seasonally Adjusted Annual Rate, or SAAR) — a 3.7% quarter-over-quarter increase. That marks the sixth consecutive quarter of growth in state and local spending, even as the national economy decelerated.
The Bureau of Economic Analysis (BEA) reported that real Gross Domestic Product (GDP) increased at a 1.5% annual rate in Q2 2026, down from Q1 — which was itself revised down from 2.0% to 1.6% in BEA's second estimate. The Q2 deceleration was partly driven by a decrease in government spending at the federal level, even as consumer spending and private investment continued to grow.
State and local governments told a different story. The combination of rising SLCE spending and increased RFP volume reinforces a pattern that firms pursuing public-sector work should understand: state and local procurement often operates on its own rhythm. Budget cycles, infrastructure backlogs, grant-funded programs, and community-driven planning don't pause when federal spending slows.
This analysis uses the same eight plain-English categories from RFPGo.ai's 2025 state and local government contracting snapshot. These categories are not an industry standard; they are a practical way to make a messy market easier to understand.
Q2 2026 at a glance
The market picked up throughout the quarter
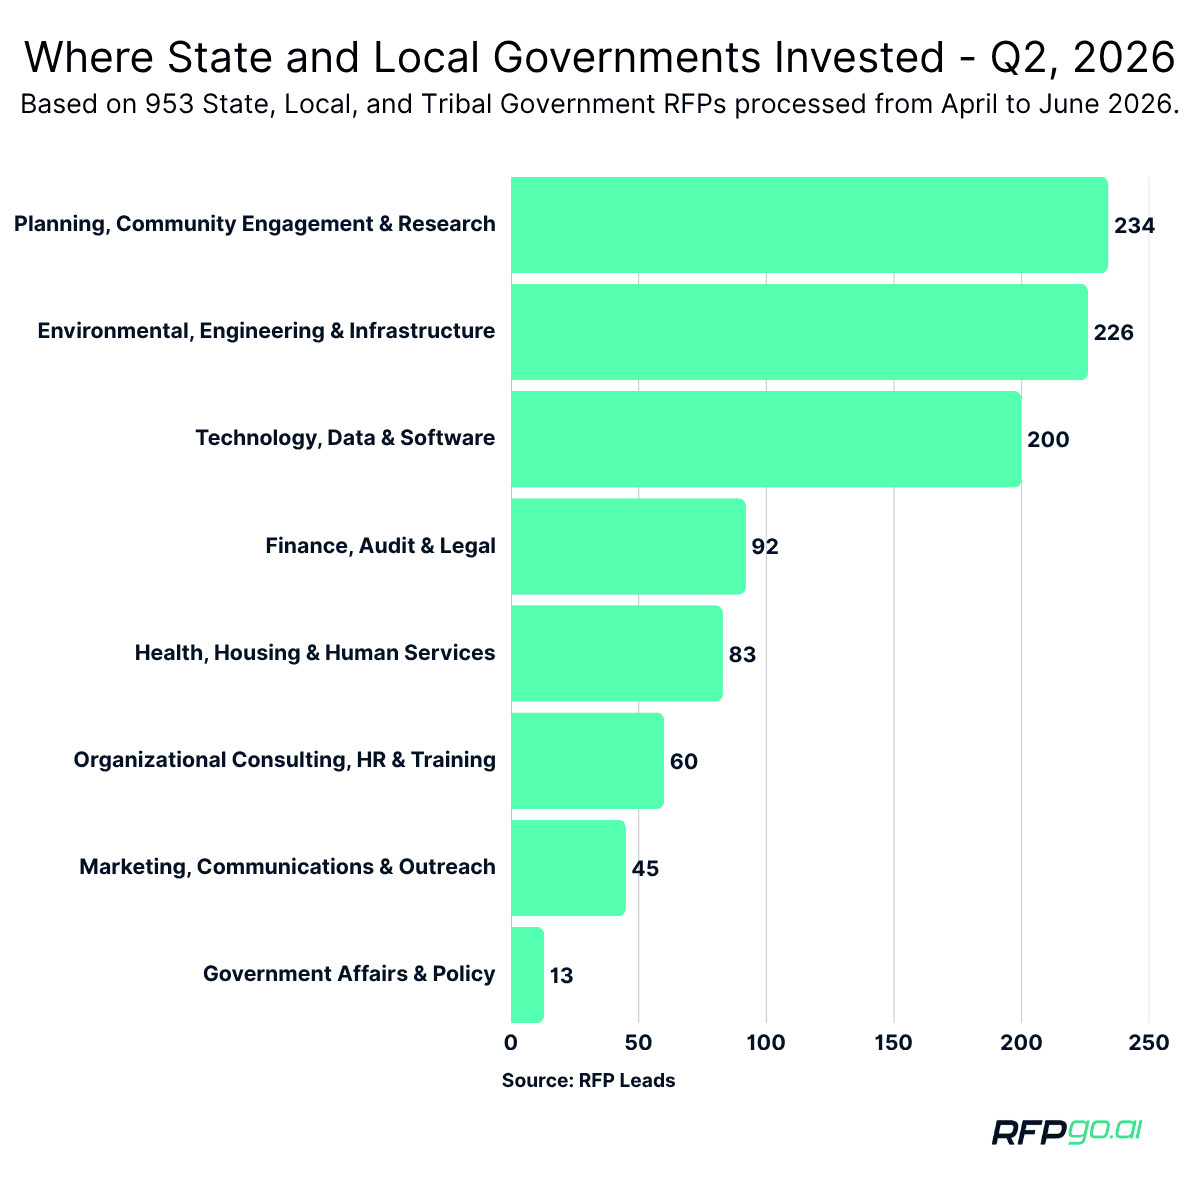
RFP volume followed a familiar pattern in Q2: activity dipped slightly in May before surging in June.
April: 312 RFPs (32.7%)
May: 285 RFPs (29.9%)
June: 356 RFPs (37.4%)
June was the strongest month of the quarter, just as March was the strongest in Q1. This end-of-quarter acceleration likely reflects agencies pushing procurement forward as budget cycles, fiscal-year planning, and contract award timelines converge.
For businesses, the lesson remains the same: RFP review cannot be occasional. Opportunities cluster, and many have short response windows.
Planning, community engagement, and research led the quarter
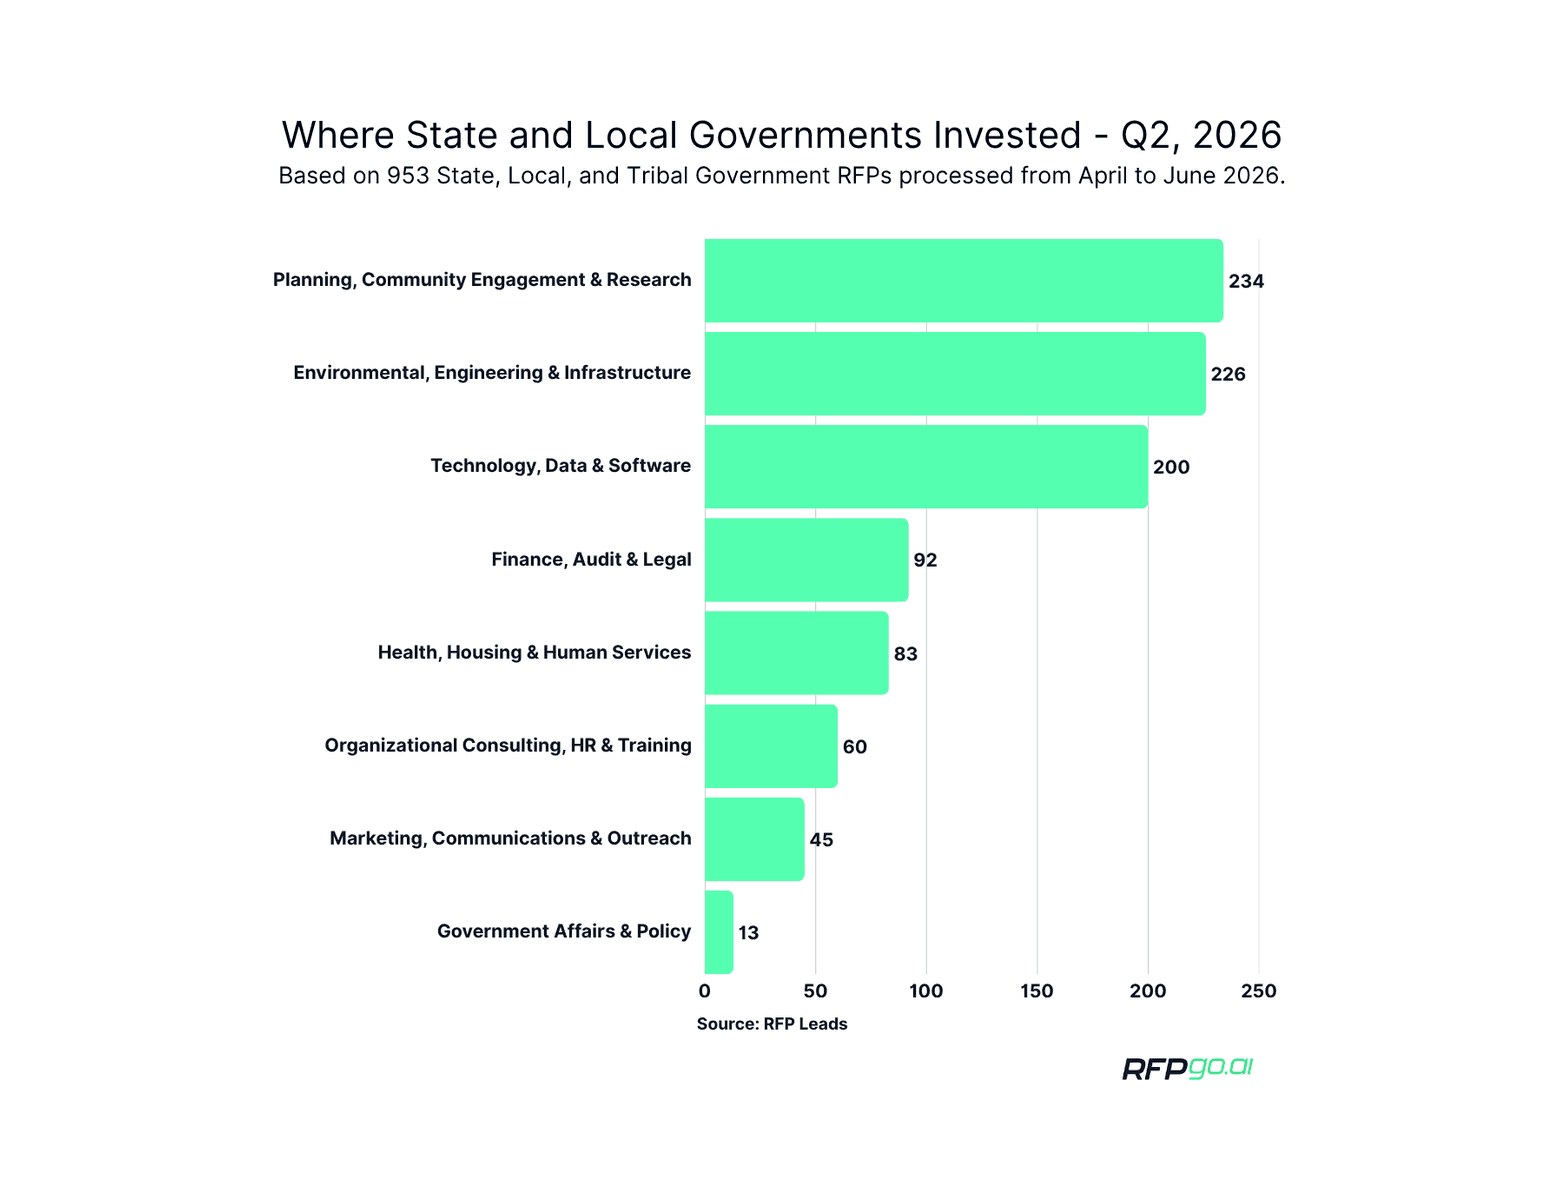
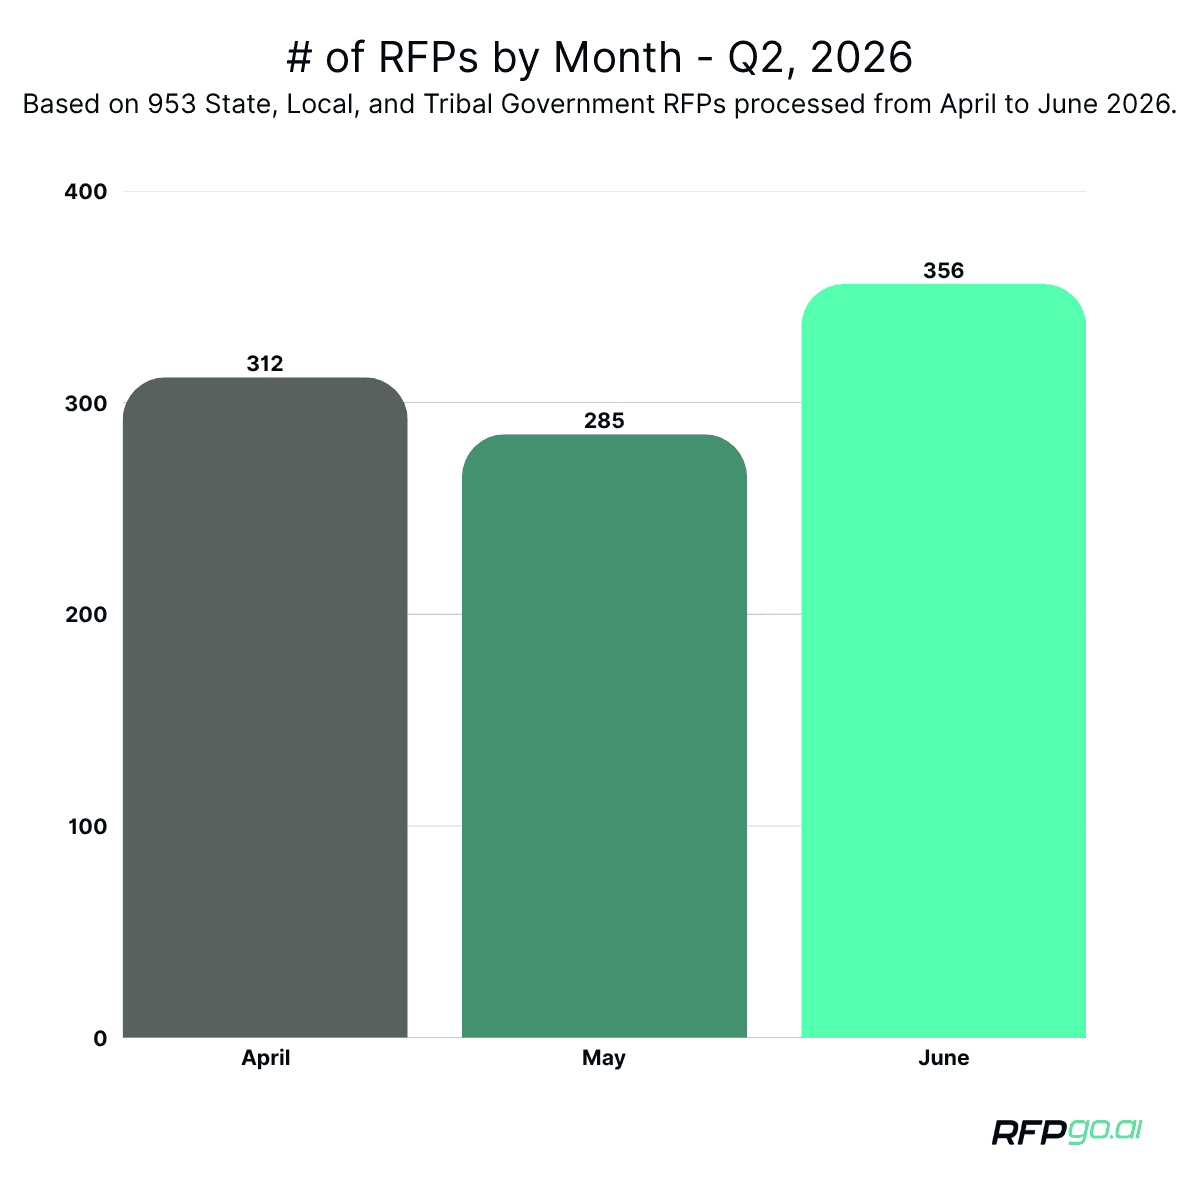
The largest category in Q2 was Planning, Community Engagement & Research, with 234 RFPs, or 24.6% of the total.
Governments continued to invest in feasibility studies, strategic plans, community visioning programs, needs assessments, program evaluations, rate studies, policy analysis, and technical reports. Specific examples from Q2 included community visioning programs, housing feasibility studies, athletic field use analyses, parking lot greening guidebooks, and long-range facility planning.
The breadth of planning work is a signal in itself. It is not one type of government or one geography. Cities, counties, state agencies, school districts, and now tribal governments are all asking the same foundational question: _What should we do next, and how do we get there?_
For consultants, evaluators, researchers, facilitators, and planning firms, this remains the largest and most consistent demand category.
Environmental, engineering, and infrastructure remained strong
Environmental, Engineering & Infrastructure accounted for 226 RFPs, or 23.7% of Q2 activity — up from 188 (22.7%) in Q1.
This category included environmental consulting, water resource management, geotechnical services, transportation engineering, capital improvements planning, regulatory compliance, sustainability consulting, and watershed restoration. Specific Q2 examples ranged from flood resilience studies and solid waste infrastructure assessments to forest biosolids planning and urban forestry management.
A notable Q2 trend: environmental and sustainability-related RFPs appeared with increasing frequency. Climate element implementation, waste characterization studies, energy department consulting, and greening guidebooks all surfaced — reflecting agencies that are not just maintaining existing systems but actively planning for climate adaptation and environmental resilience.
This growth is consistent with the SLCE data. State and local gross investment — the component of SLCE that captures infrastructure and capital spending — has been trending upward, and the professional services RFPs we see are often the precursors to those capital investments: the studies, designs, and plans that come before construction.
Technology, data, and software was the biggest percentage gainer
Technology, Data & Software accounted for 200 RFPs, or 21.0% of Q2 activity — up from 140 (16.9%) in Q1. That jump from 16.9% to 21.0% made technology the largest percentage gainer of any category.
Q2 included RFPs for fire records management systems, contact center solutions, electronic health records analysis, identity management systems, demand response transit software, project management platforms, sidewalk assessment software, cyber program administration, and Artificial Intelligence (AI)-powered wildfire detection systems.
Two things stand out. First, the technology RFPs are not concentrated in large state agencies. Cities, counties, school districts, and transit authorities are all modernizing, often through targeted software procurements rather than massive enterprise overhauls. Second, AI and advanced analytics appeared in Q2 in new contexts — including a City of Pasadena Request for Information (RFI) for early wildfire detection using AI and thermal monitoring, a signal that emerging technology is starting to reach municipal procurement.
Finance, audit, and legal nearly doubled
Finance, Audit & Legal accounted for 92 RFPs, or 9.7% of Q2 activity — up from 49 (5.9%) in Q1.
Q2 opportunities included sales and use tax audit services, transient occupancy tax services, bond underwriting, investment custodial services, property casualty insurance, and construction risk management. The near-doubling of this category may reflect fiscal-year-end activity, with agencies closing out audits, renewing financial services, and preparing for new budget cycles.
Health, housing, and human services remained important but shifted
Health, Housing & Human Services accounted for 83 RFPs, or 8.7% of Q2 activity — down from 112 (13.5%) in Q1.
Q2 opportunities included interim recovery housing, supportive housing consulting, fair housing programs, community health worker curriculum design, opioid abatement strategies, mental health wellness programs for police departments, youth development programs, and community mobilization services.
The percentage decline does not necessarily signal reduced demand. Many human services contracts are multi-year, and Q1 may have captured a cycle of renewals. The category remains complex, local, and important for nonprofits, community-based organizations, and public health consultants.
Organizational consulting, Human Resources (HR), and training held steady
Organizational Consulting, HR & Training accounted for 60 RFPs, or 6.3% of Q2 activity — up from 47 (5.7%) in Q1.
Q2 examples included workforce development plans, succession planning, stress management trainings, leadership development, compensation studies, workers compensation claims administration, and clinical scribe services. Governments continue to face persistent internal capacity challenges.
Marketing, communications, and outreach maintained its presence
Marketing, Communications & Outreach accounted for 45 RFPs, or 4.7% of Q2 activity.
Q2 examples included creative services for outreach, strategic communications support, and community engagement strategy work.
Government affairs and policy remained the smallest category
Government Affairs & Policy accounted for 13 RFPs, or 1.4% of Q2 activity — up from 6 (0.7%) in Q1. Q2 examples included state legislative lobbying services and federal government relations consulting. These opportunities are infrequent but highly targeted.
The diversity of government entities continues to expand
Q2 continued to show one of the defining characteristics of the state and local RFP market: the extraordinary diversity of entities that issue RFPs.
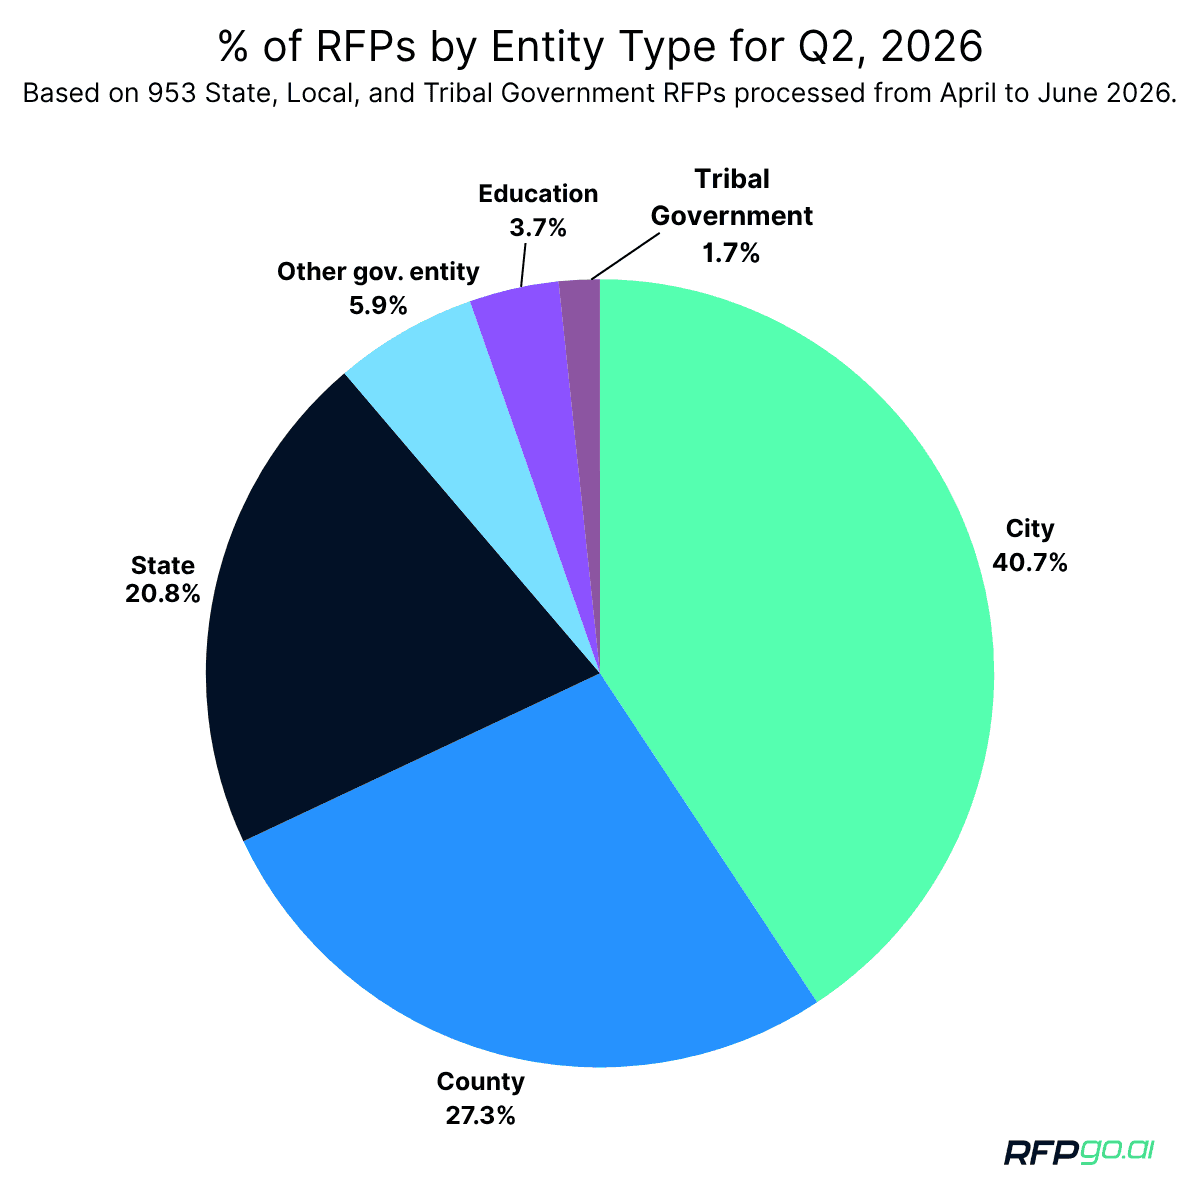
The 953 Q2 RFPs came from 272 unique government entities across four states:
Cities: 388 RFPs (40.7%)
Counties: 260 RFPs (27.3%)
State agencies: 198 RFPs (20.8%)
Other government entities: 56 RFPs (5.9%)
Education: 35 RFPs (3.7%)
Tribal governments: 16 RFPs (1.7%)
A Q2 milestone: RFPGo.ai now aggregates RFPs from tribal governments in the states we cover. Tribal nations operate their own procurement processes independently of state and local systems, and their solicitations are often published on separate portals that many businesses never see. Adding tribal government coverage extends our reach into an important and underserved segment of the public-sector market.
Cities and counties together accounted for 68.0% of Q2 volume. That is lower than Q1's 82.0%, driven by a significant increase in state-level RFPs (from ~10% to 20.8%). This shift may reflect state agencies ramping up procurement in the second quarter as legislative sessions conclude and appropriations are finalized.
Most RFPs still did not include a stated budget
281 of the 953 RFPs included a stated budget, or 29.5% — nearly identical to Q1's 29.6%.
More than 70% of opportunities still do not provide a clear budget. For businesses, this remains a practical reminder: budget transparency is uneven. Firms need a disciplined bid/no-bid process that evaluates scope, agency size, contract type, historical spending, and proposal burden — not just whether a dollar figure is listed.
What Q2 means for the rest of 2026
Federal spending is pulling back, but state and local governments are moving in the opposite direction. That's not just our data saying it — the BEA's GDP report shows federal spending declining while the FRED SLCE series shows state and local investment growing for the sixth straight quarter. Our RFP volume — 953 RFPs from 272 entities, up 15% over Q1 — corroborates what the macro data is showing.
For businesses pursuing public-sector work, the opportunity isn't shrinking. It's shifting. Four dynamics are worth watching:
1. State and local procurement is operating independently of federal spending trends. Budget cycles, infrastructure backlogs, and grant-funded programs are driving procurement on their own timelines—regardless of what's happening in Washington.
2. Technology procurement is accelerating. The jump from 16.9% to 21.0% of total volume — and the appearance of AI-related RFPs at the municipal level — suggests modernization demand is broadening, not plateauing.
3. Environmental and sustainability procurement is expanding. Climate adaptation, energy consulting, waste characterization, and urban forestry surfaced with enough frequency in Q2 to suggest a growing demand category.
4. AI is entering municipal procurement. It is early, but AI-related RFPs in cities like Pasadena signal that emerging technology is moving from state-level experimentation to municipal-level procurement.
The businesses that win public-sector work in 2026 are the ones that show up consistently. Weekly review rhythms, disciplined bid/no-bid processes, and broad geographic discovery are what separate businesses that find the right opportunities from those that miss them.
For firms building a public-sector pipeline in 2026, the message is consistent with Q1 but sharper: the opportunity is growing, and it rewards businesses that show up consistently. Weekly review rhythms, disciplined bid/no-bid processes, and broad geographic discovery are the habits that separate businesses that find the right opportunities from those that miss them.
---
Every week, we turn hundreds of messy government procurement documents into clear, actionable professional services RFP leads — sourced from cities, counties, state agencies, tribal governments, and special districts across the Pacific Northwest and California. To discover the value we create and learn more, visit RFPGo.ai.
---
Sources
Bureau of Economic Analysis — GDP (Advance Estimate), 2nd Quarter 2026. Real GDP increased 1.5% (annual rate). Government spending decreased.
Bureau of Economic Analysis — GDP (Second Estimate), 1st Quarter 2026. Q1 GDP revised from 2.0% to 1.6%.
Federal Reserve Economic Data (FRED) — State and Local Consumption Expenditures & Gross Investment, SLCE series. Q1 2026: $3,429.3B; Q2 2026: $3,557.7B (SAAR). Sixth consecutive quarter of growth. Source: U.S. Bureau of Economic Analysis.


